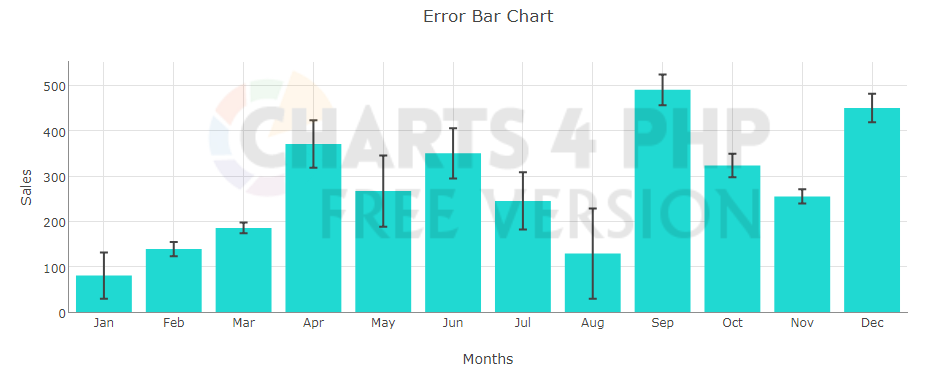
Error bars are graphical representations of the variability of data and used on graphs to indicate the error or uncertainty in a reported measurement.
Its really easy to make Error bars graphical representation in chartphp.
Step 1: Include Charts 4 PHP Library
include("../../lib/inc/chartphp_dist.php");
$p = new chartphp();
Step 3: Set Array Configuration
$errbar_data =
       array(
          array(
            array("Jan",80.25,51),
            array("Feb",138.75,15.5),
            array("Mar",185.50,12),
            array("Apr",370.50,52.5),
            array("May",266.80,78.5),
            array("Jun",350,55.5),
            array("Jul",245,63),
            array("Aug",129,99.5),
            array("Sep",490,33.9),
            array("Oct",323,26),
            array("Nov",255,15.5),
            array("Dec",450,31.5)
               ) );
$p->data = $errbar_data ;
Step 3: Set Chart type
$p->chart_type = "error-bar";Step 4: Render Chart
$out = $p->render("c1");
Whats Next:
- To download latest free version (with limited features), please visit our Download page.
- For existing paid customers who want to renew/upgrade, please visit Upgrade page.