Documentation
Contents
Charts 4 PHP Framework Documentation
Setup
Installing Demos
Step 1) Place all files in a directory on the web server. e.g. “…/www/chartphp/”
Step 2) Run the product demos in browser. e.g. http://localhost/chartphp/index.php
Integration in your Project
For integration in your app, copy ‘lib’ folder to your project. You might need to consider 2 things.
Step 1) The folder “…/…/lib” will be replaced by path where you place ‘lib’ folder (if changed)
<link rel="stylesheet" href="../../lib/js/chartphp.css">
<script src="../../lib/js/jquery.min.js"></script>
<script src="../../lib/js/chartphp.js"></script>
Step 2) Update include path where you place lib/inc/chartphp_dist.php. (if changed)
include("../../lib/inc/chartphp_dist.php");
$p = new chartphp();
Upgrading from older version
Simply override lib/inc & lib/js from latest build to the chartphp folder in previous implementations.
Same applies to upgrade from free to full version.
Getting Started
Creating your First Chart
Step1: Add PHP Chart configuration code
<?php
// include and create object
include("../../lib/inc/chartphp_dist.php");
$p = new chartphp();

// set few params
$p->data =array(array(3,7,9,1,4,6,8,2,5),array(5,3,8,2,6,2,9,2,6));
$p->chart_type = "area";

// render chart and get html/js output
$out = $p->render('c1');
?>
Step2: Include JS and CSS files in your html page
<!DOCTYPE html>
<html>
<head>

	<script src="../../lib/js/jquery.min.js"></script>

</head>
Step3: Print the $out variable where you wish to display chart.
<body>
	<div style="margin:10px">

	<!-- display chart here -->
	<?php echo $out?>
	<!-- display chart here -->

	</div>
</body>
</html>
Resources
- Live demo
- You can check this demo in archive
demos/basic/area.php
Explanation
- The PHP Part configured the chart and rendered the output to $out variable.
- In HTML Part, we displayed the generated chart code
$outalong with few external css/js files. It’s up to you to place external css and js files at appropriate locations. ->render()will generate the final output, to be displayed in view. It takes chart ID as input, which should be unique on a page.
Setting Chart Options
Based on following example code, we can add many other chart params.
<?php
// include and create object
include("../../lib/inc/chartphp_dist.php");
$p = new chartphp();

// set few params
$p->data =array(array(3,7,9,1,4,6,8,2,5),array(5,3,8,2,6,2,9,2,6));
$p->chart_type = "area";

// render chart and get html/js output
$out = $p->render('c1');
?>
Chart Type
Currently following chart types are supported:
- line
- area
- area-stacked
- bar
- bar-grouped
- bar-stacked
- candlestick
- donut
- error-bar
- pie
- bubble
- heatmap
- histogram
- meter
- funnel
Usage:
$p->chart_type = "area";
Chart Title
$p->title = "Category Sales";
Chart Labels
$p->xlabel = "My X Axis";
$p->ylabel = "My Y Axis";
Chart Ticks
$p->showxticks = true;
$p->showyticks = true;
Target Line
The target line can be applied to bar, bar stack and bar group chart.
Set Targetline x axis start
$p->targetx_start = 20;
Set Targetline x axis end
$p->targetx_end = 20;
Set Targetline y axis start
$p->targety_start = "Hybrid";
Set Targetline y axis end
$p->targety_end = "Truck";
Set Targetline color
$p->targetline_color = "green";
Set Targetline width
$p->targetline_width = 4;
Set Targetline style, it can be dashdot or line
$p->targetline_style = "dashdot";
Resources
Chart Legend
Set legend labels
$p->series_label = array("Team1","Team2","Team3","Team4");
Set legend orientation
$p->legend["orientation"] = "h";
Hiding legends
$p->legend["show"] = false;
Chart Logo
You can specify custom logo by giving:
- source ( URL or local path),
- position (top-left, top-right, bottom-left, bottom-right, center)
- transparency between (0-1). 1 means full opaque.
Example:
$p->logo["source"] = "http://domain.com/logo.png";
$p->logo["position"] = "top-left";
$p->logo["transparency"] = 0.8;
Bar, Bar Stack, Bar Group Chart Direction
$p->direction = "horizontal";
Chart Data
You can either specify data points:
$p->data = array(array(array("2010/10",48.25),array("2011/01",238.75),array("2011/02",95.50)));
or include a file with data arrays
include("../../example_data.php");
$p->data = $area_chart_data;
To create chart directly from database query:
$p->data_sql = "select c.categoryname, sum(a.UnitPrice * a.Quantity) as Sales
				from products b, `order details` a, categories c
				where a.productid = b.productid and c.categoryid = b.categoryid
				group by c.categoryid
				order by c.categoryid";
For Database driven charts, refer ‘Database Integration’ topic in docs.
Chart Colors
To specify the colors manually, the number of colors specifications must be more than or equal to data values.
// set color to green for one data value
$p->color = "green";

// set color to red,blue,green for three data values
$p->color = "red,blue,green";

// set colors using rgb
$p->color = ["rgb(148,0,211)","rgb(0,0,255)","rgb(0,255,0)" ,"rgb(255,0,0)"];

// set colors using hex code
$p->color = "#1AAF5D,#F2C500,#F45B00,#8E0000,#0E948C";

// set colors using color series
$p->color ="soft";

// set metro theme color series
$p->color ="metro";

// set heatmap color series
// Options: green, orange, gray, hot, violet, black, blue, soft
$p->heatmap_color = "black";
More than one colors are used for pie,donut,bubble OR e.g. multi-line chart.
Chart Background Color
You can specify different background color (beside white on light theme, black on dark theme).
$p->bgcolor = "#3d3d3d";
You can also set transparency with colors
// 5% white color background
$p->bgcolor = "rgba(255,255,255,0.05)";
or simply full transparent
$p->bgcolor = "transparent";
Chart Theme
By default charts come with light theme. To switch to dark theme background, you can set:
$p->theme = "dark";
Chart Dimensions
You can specify width x height in % or px.
$p->width = "80%";
$p->height = "100%";
Export Options
You can hide/show export button on chart top-right:
// defaults to true
$p->export = false;
Database Integration
Step1 is to set database configuration in config.php.
To connect to MySqli:
define("CHARTPHP_DBTYPE","mysqli");
define("CHARTPHP_DBHOST","localhost");
define("CHARTPHP_DBUSER","user");
define("CHARTPHP_DBPASS","pass");
define("CHARTPHP_DBNAME","northwind");
To connect using PDO:
define("CHARTPHP_DBTYPE","pdo");
define("CHARTPHP_DBHOST","sqlite:../../sampledb/Northwind.db");
define("CHARTPHP_DBUSER","");
define("CHARTPHP_DBPASS","");
define("CHARTPHP_DBNAME","");
Next is to include configuration file in your code.
include("../../config.php");
Final Step is to define data_sql property, that will load data points from database.
$p->data_sql = "select strftime('%Y-%m',o.orderdate) as Year, sum(d.quantity) as Sales
				from `order details` d, orders o
				where o.orderid = d.orderid
				group by strftime('%Y-%m',o.orderdate)";
Resources
- Live demo
- Code Sample
- You can check this demo in archive
demos/database/bar.php
Google Sheets Integration
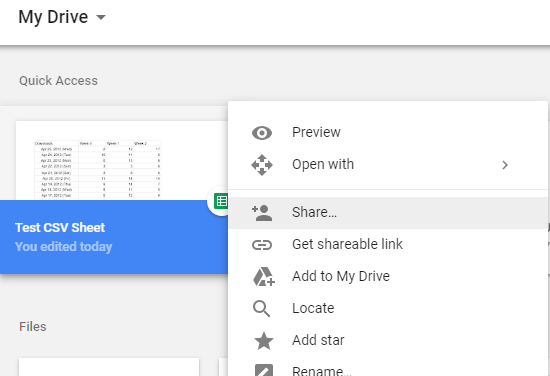
Step 1: Give permission to access to access Google Spreadsheet
Before proceeding to next step make sure that your google sheet have permission to view :
Goto your My Driver folder and right click on the spreadsheet you want to share. Then select : _“Anyone with the link can view “_from dropdown . _(See screenshots)
Step 2: Add your spreadsheet key and sheet name
Change the key and sheet_name as given in your spreadsheet with following format :
https://docs.google.com/spreadsheets/d/{key}/gviz/tq?tqx=out:csv&sheet={sheet_name}
in our case, after adding key and sheet name, the url becomes
https://docs.google.com/spreadsheets/d/1KkNJxvjhpjyzUu-0EW0xmhnYxKN8RPeEqhctxKJkx3s/gviz/tq?tqx=out:csv&sheet=Sheet1`
Step 3: Include Charts 4 PHP Library
include("../../lib/inc/chartphp_dist.php"); $p = new chartphp();
Step 4: Set your google sheet url in a string
So finally we have this link (saved in url variable) :
$url = "https://docs.google.com/spreadsheets/d/1KkNJxvjhpjyzUu-0EW0xmhnYxKN8RPeEqhctxKJkx3s/gviz/tq?tqx=out:csv&sheet=Sheet1";
$p->data_csv_url = $url;
In our case-example the sheet is:
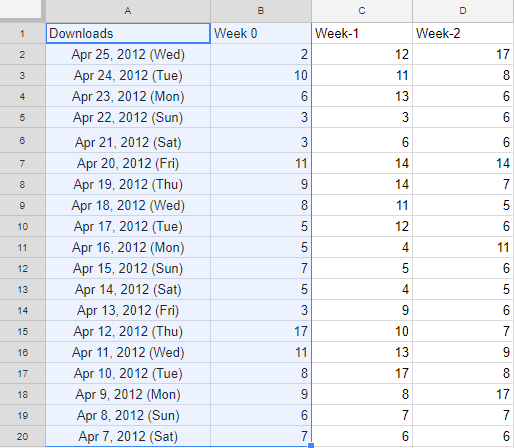
By default , first column (Downloads) and second column (Week 0) are selected (highlighted above). To make charts from other 2 columns, see Documentation.
Also Note that the chart will be made for 2 columns only. More than 2 columns are currently not supported.
If you want to override csv file x and y column numbers you can do like this :
$p->csv_xindex = 1;
$p->csv_yindex = 2;
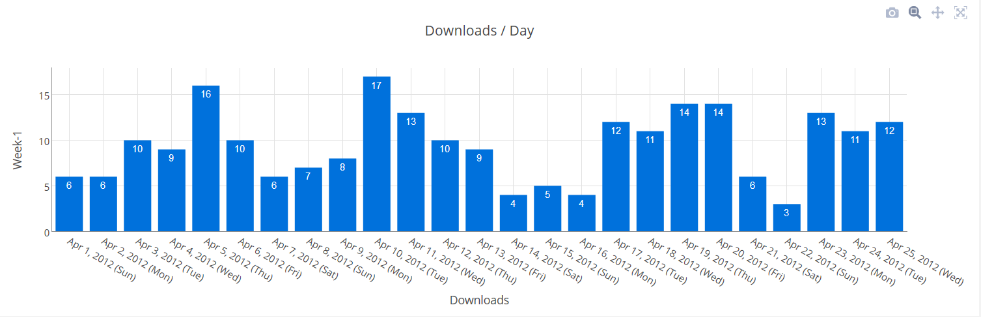
Step 4: Set title for the chart
$p->title = "Downloads / Day";
Step 5: Render Chart
$out = $p->render("c1");
Result:
Resources
- Live demo
- Code Sample
- You can check this demo in archive
demos/integration/google-sheets.php
Updated: Tuesday, Feb 5th, 2019