This article will show how to create a dashboard using Charts 4 PHP Framework with or without database (mySQL, Oracle, PDO etc.) at back end.
I. Creating first chart in Dashboard
Step 1: Configure Database connectivity in config.php
define("CHARTPHP_DBTYPE","pdo");
define("CHARTPHP_DBHOST","sqlite:../../sampledb/Northwind.db");
define("CHARTPHP_DBUSER","");
define("CHARTPHP_DBPASS","");
define("CHARTPHP_DBNAME","");
Step 2: Include Charts 4 PHP Library in Dashboard HTML
include("../../lib/inc/chartphp_dist.php");
$p = new chartphp();
Step 3: Select any one of the substep below to configure Data Array
Step 3a: Configure Data array
$p->data = array(array(
array('Heavy Industry', 12),
array('Retail', 9),
array('Light Industry', 14),
array('Out of home', 16),
array('Commuting', 7),
array('Orientation', 9)));
Step 3b: Configure Data array using jQuery to fetch data from Database (e.g. for SQLite DB)
$p->data_sql = "select c.categoryname, sum(a.UnitPrice * a.Quantity) as Sales
                from products b, `order details` a, categories c
                where a.productid = b.productid and c.categoryid = b.categoryid
                    group by c.categoryid
                    order by c.categoryid";
Step 4: Set Chart type
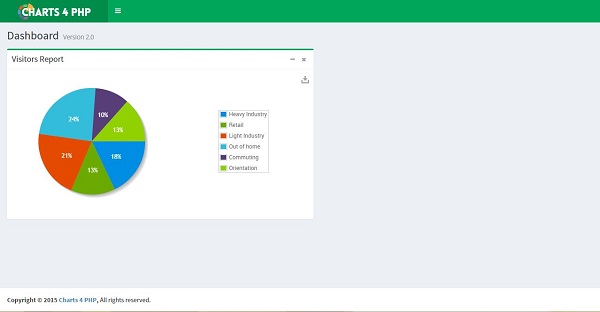
$p->chart_type = "pie";
Step 5: Render Chart
$out = $p->render("c1");
This will give you a single chart in your dashboard something like this.
II. Creating multiple charts in your Dashboard
Step 1: Configure multiple charts into your Dashboard HTML
$p = new chartphp();
$p->data = array(array(array("2010/10",48.25),array("2011/01",238.75),array("2011/02",95.50),array("2011/03",300.50),array("2011/04",286.80),array("2011/05",400)));
$p->chart_type = "bar";
$out_bar = $p->render('c2');

$p = new chartphp();
$p->data = array(array(array(60, 123, 1067, "Acura"), array(11, 92, 1236, "Alfa Romeo"), array(30, 200, 610, "AM General"), array(50, 23, 800, "Aston"), array(18, 17, 539, "Audi"), array(50, 89, 1026, "BMW"), array(99, 13, 864, "Bugatti")));
$p->chart_type = "bubble";
$out_bubble = $p->render('c3');

$p = new chartphp();
$p->intervals = array(200,300,400,600);
$p->chart_type = "meter";
$p->width = "200px";
$p->height = "150px";
$p->data = array(array(rand(200,600)));
$out_meter = $p->render('c4');
$p->data = array(array(rand(200,600)));
$out_meter2 = $p->render('c41');
$p->data = array(array(rand(200,600)));
$out_meter3 = $p->render('c42');
$p->data = array(array(rand(200,600)));
$out_meter4 = $p->render('c43');
Step 2: Render multiple charts in your dashboard to get the final look like this:
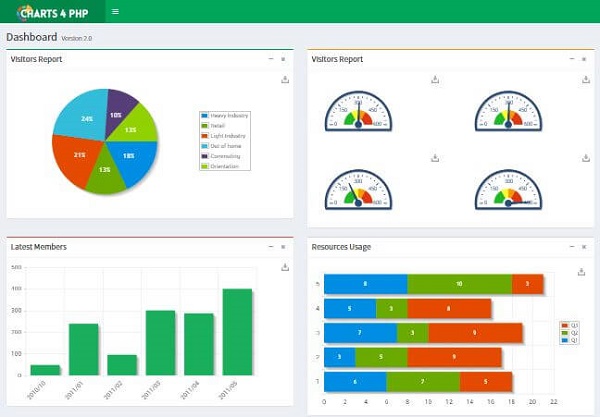
For complete code, please visit live demo.
Whats Next:
- To download latest free version (with limited features), please visit our Download page.
- To buy full functional paid version with technical support, please visit our Pricing page.
- For existing paid customers who want to renew/upgrade, please visit Upgrade page.